


18 Mar, 2024
18 Mar, 2024
Fathom takes pride in our best-in-class reporting and we’ve just added new features to make this area of Fathom even better for our users. Learn about 'KPIs by Company', 'KPI Comparatives' and Breakdown Analysis enhancements.
Transform your financial data into clear insights to share in reports with stakeholders. See how our latest product releases improve the report editing experience and add new options for surfacing KPI results.
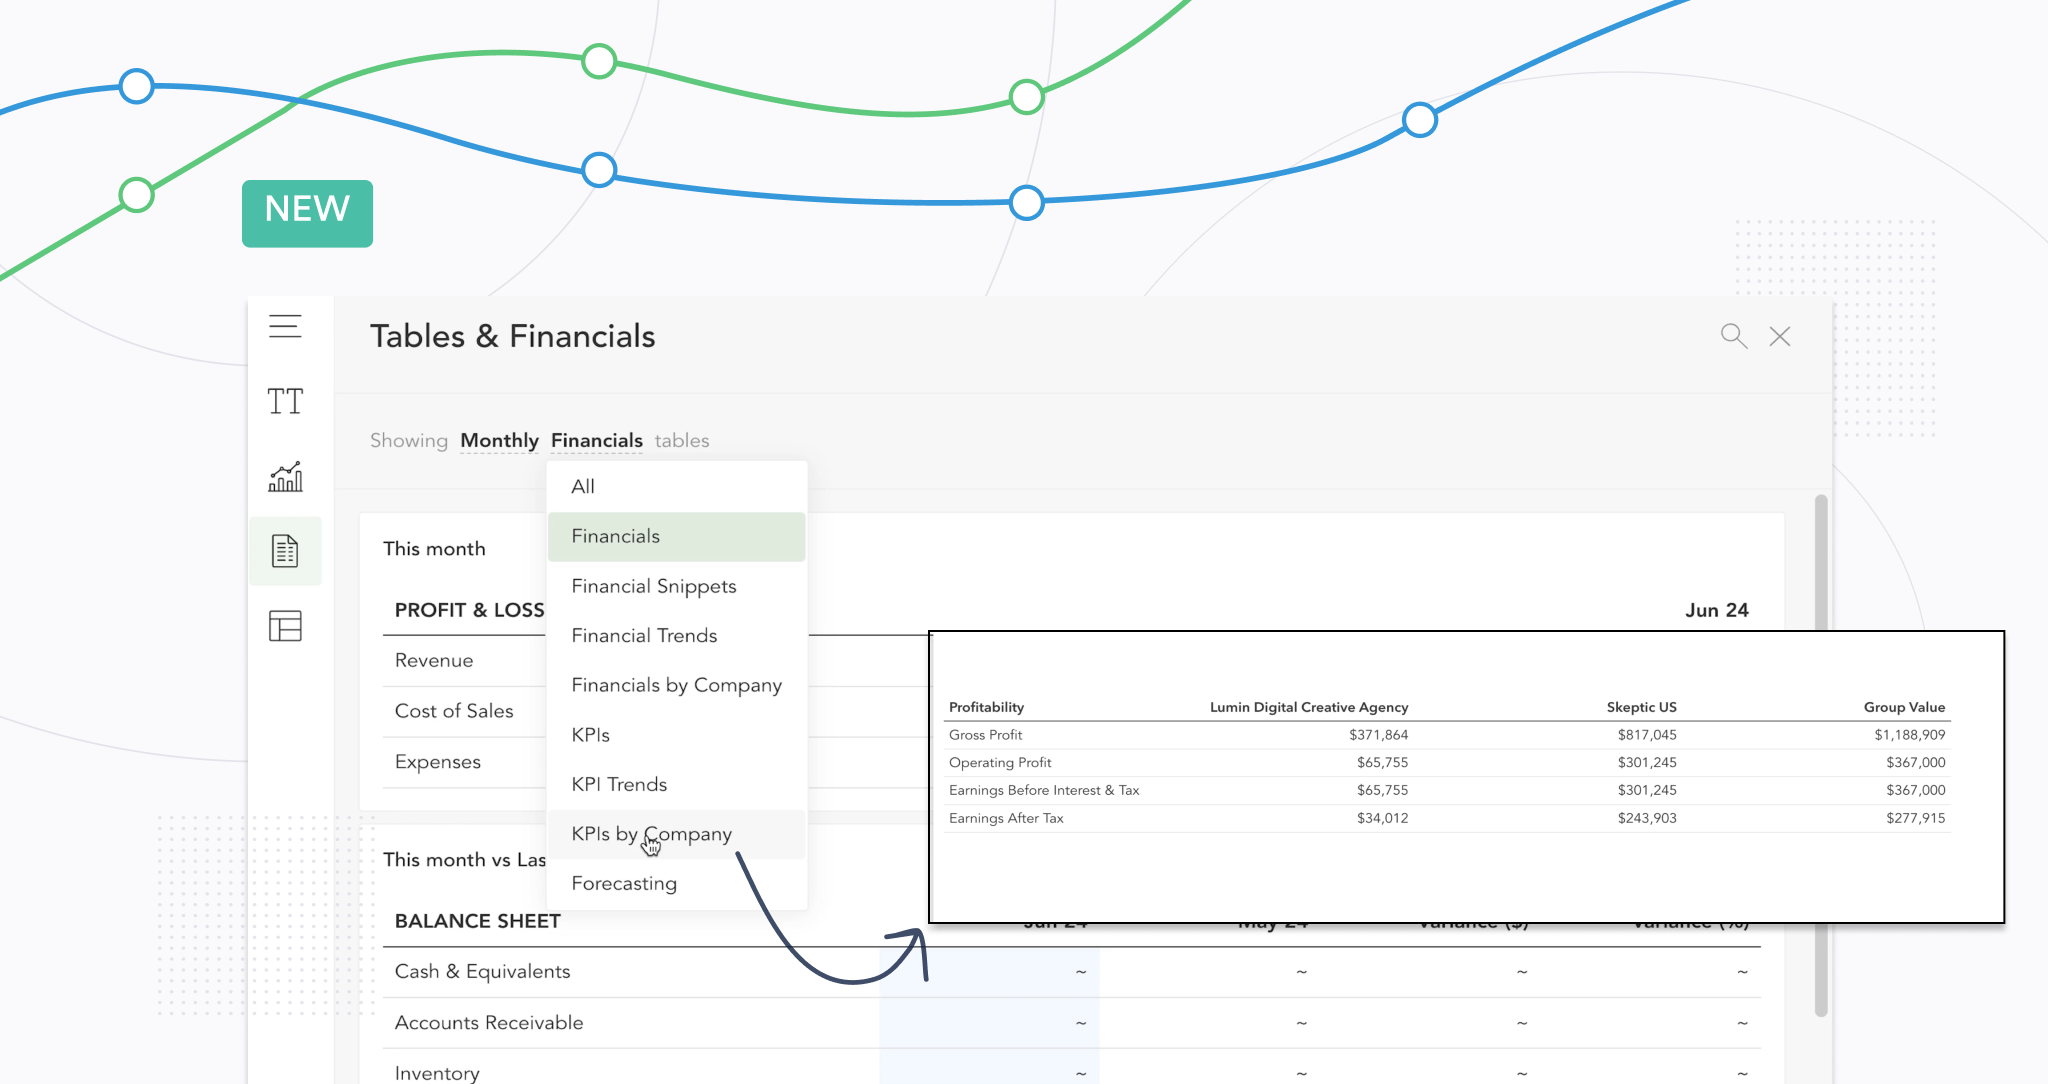
Fathom's new ‘KPIs by Company’ table provides a side-by-side view of KPI performance for companies within your consolidated group. Use this table to measure results for all KPIs, including custom metrics.
Compare any metric from KPIs, P&L, Balance Sheet, or Cash Flow in a consolidation from the subsidiary companies. You can also pull revenue out as an ‘account watch KPI’ in each underlying company and view them side-by-side and compared to the group total .
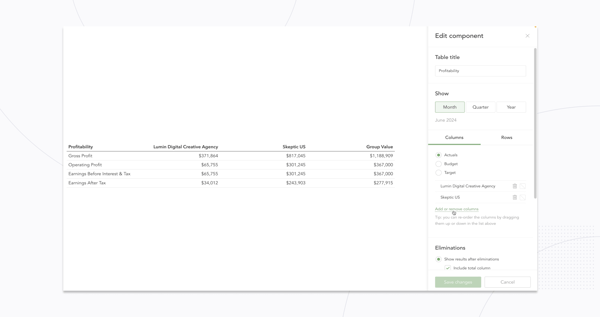
The 'KPIs by Company' table also enables you to compare budgets or targets for each company, including subsidiary targets from within the consolidated report.
You can see how results compare to group totals, shown in an optional total column in the table.
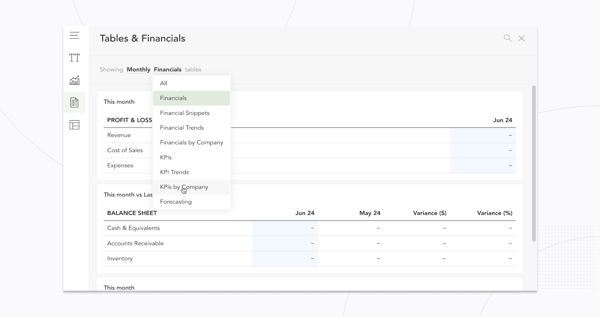
You’ll find the new 'KPIs by Company' table under ‘Tables and Financials’ within the component gallery while editing a Fathom report.
The new 'KPI Comparatives' table provides a view of individual company performance for a single KPI within the context of a consolidated group.
This allows you to highlight key KPI metrics across subsidiaries and show comparative to targets or over different historical periods.
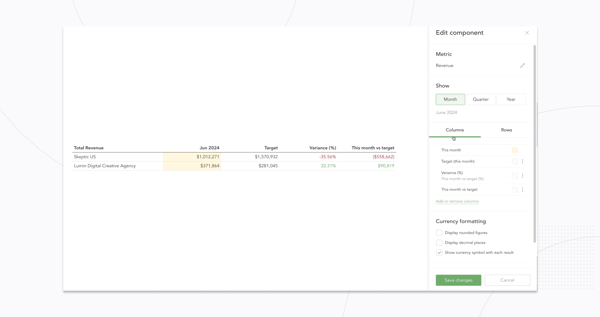
You’ll find the 'KPI Comparatives' table under ‘Tables and Financials’ within the component gallery while editing a Fathom report.
This release also includes the addition of a company filter to the existing KPI table.
A new company filter allows you to filter your custom financials (built using KPI tables) to a subsidiary company, in a similar way to the filtering available on Financial tables.
The Breakdown Analysis tool in Fathom shows how individual companies within a consolidated group, or individual tracking categories (class, location, etc.) within a company, perform against a specific measure.
Last year we added new comparison options to the Breakdown Analysis tool giving users the options to compare to prior periods or budget numbers.
We’re now bringing these comparative options through to the Breakdown component within reports, so these insights can be saved and shared with key stakeholders.
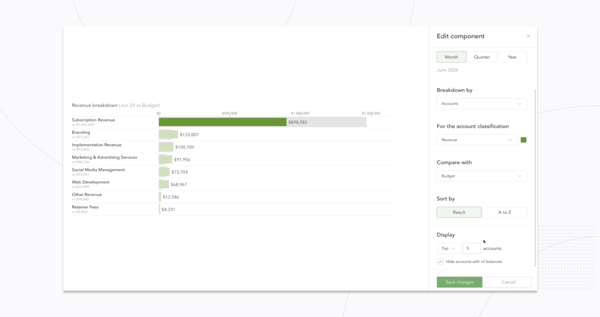
You’ll find the Breakdown Chart within the component gallery under Charts in a custom Fathom report.
Have you spent time creating the perfect chart, graph, or text component in a report, only to realise there's been a mistake?
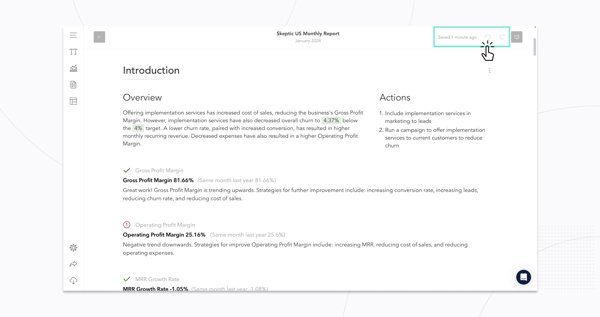
Easily backtrack using the ‘undo’ button to revert to the previous version of your report component.
You’ll find the ‘undo’ and ‘redo’ options in the top right corner while editing a custom Fathom report.
Questions, comments or feedback? We'd love to hear from you. Get in touch by sending an email to support@fathomhq.com.
Ready to try it in Fathom?
or